Use ComplexHeatmap to visualize TEs data from TEKRABber result
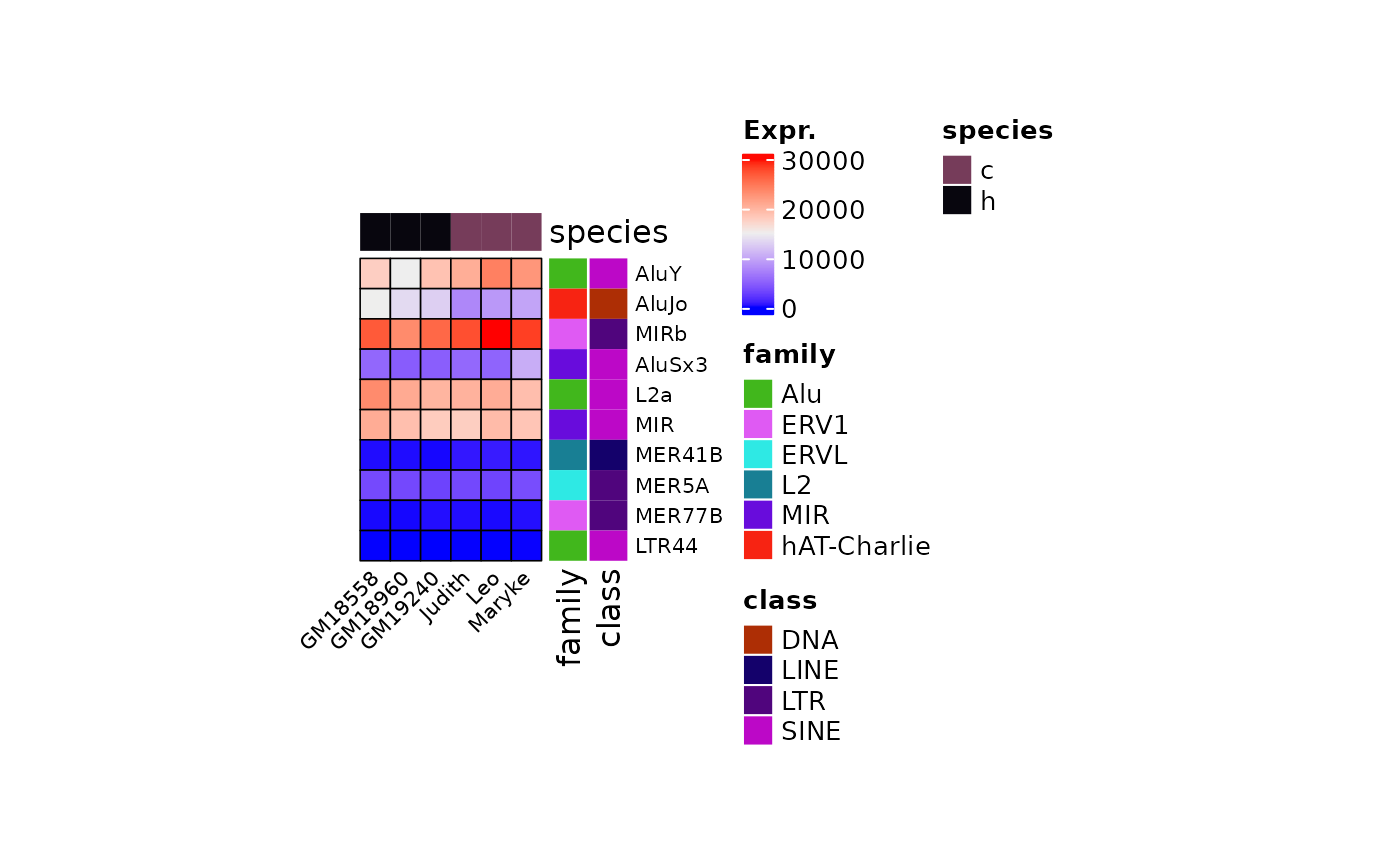
teComplexHeatmap.RdThis function use ComplexHeatmap::Heatmap() to visualize TEs data generated from using TEKRABber. The input dataframe is the file with extension teDESeq2norm.csv from TEKRABber. You can specified how many of the TEs you want to visualize. The default is showing the top 40 TEs with the highest row means among all samples. You can also specify a list to filter out a subset of TEs using the teFilter parameters. If you face an error with could not find function "unit", you need to load the ComplexHeatmap library to your workspace.
Usage
teComplexHeatmap(
  df,
  teFilter = NULL,
  top = 40,
  fileName = NULL,
  speciesAnnot = NULL,
  teAnnot = NULL
)
Arguments
- df
a TEKRABber teDESeq2norm table
- teFilter
a list of transposable elements subsets
- top
a numeric value to show top number of genes in heatmap
- fileName
the name for saving pdf file (if specified)
- speciesAnnot
a vector containing species information for top annotation on heatmap
- teAnnot
a vector containing class and family information for row annotation on heatmap