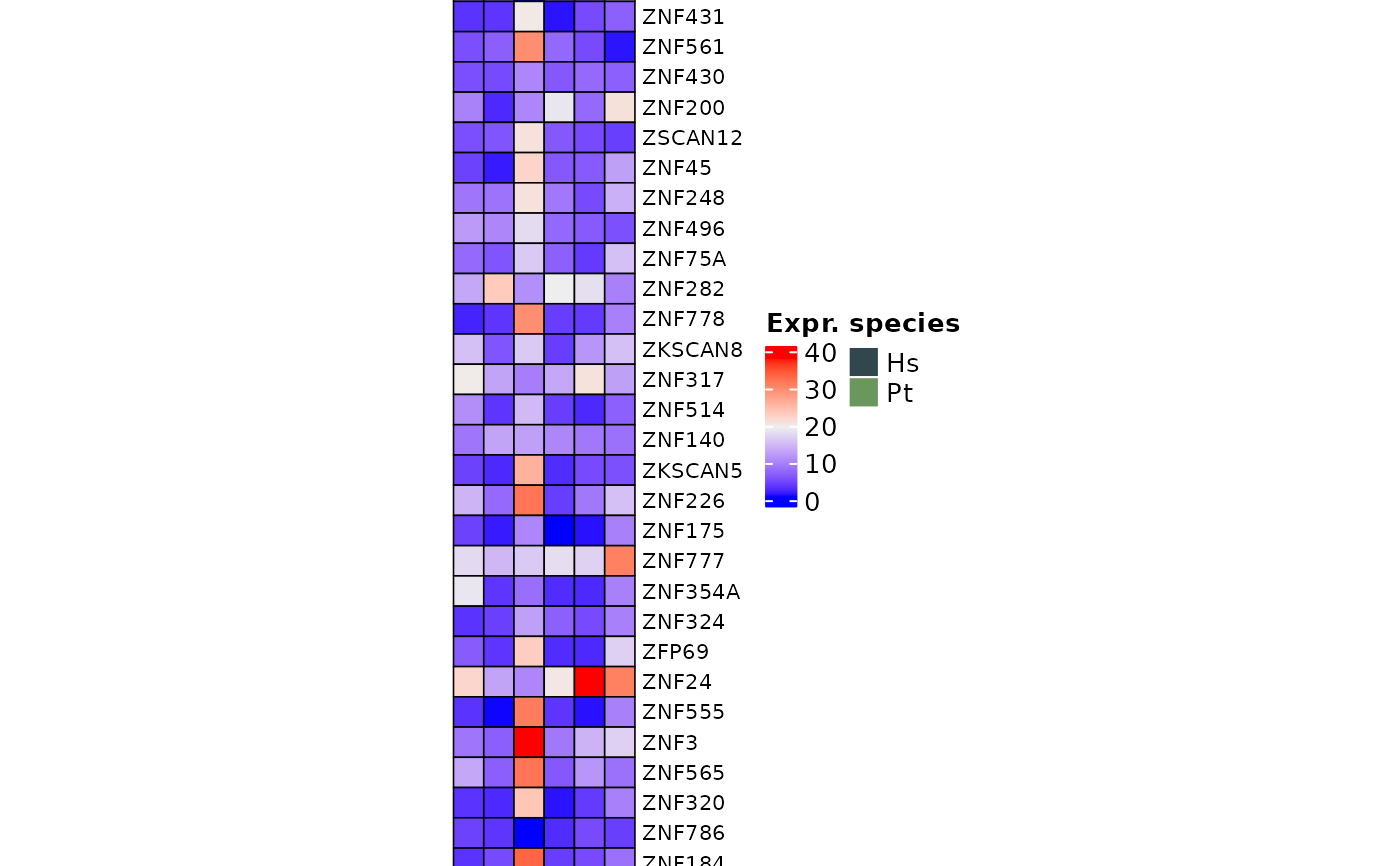
Use ComplexHeatmap to visualize KZNFs data from TEKRABber result
kznfsComplexHeatmap.RdThis function use ComplexHeatmap::Heatmap() to visualize KZNFs data generated from using TEKRABber. First it will load the built-in hmKZNFs337 and filter the dataframe. The dataframe is the file with extension geneDESeq2norm.csv from TEKRABber. You can specified how many of the KZNFs you want to visualize. The default is showing the top 40 KZNFs with the highest row means among all samples. If you face an error with could not find function "unit", you need to load the ComplexHeatmap library to your workspace.
Usage
kznfsComplexHeatmap(
  df,
  top = 40,
  species = "hsapiens",
  fileName = NULL,
  orderMean = FALSE,
  speciesAnnot = NULL
)
Arguments
- df
a TEKRABber geneDESeq2norm table
- top
a numeric value to show top number of genes in heatmap
- species
indicate the species name to convert ID
- fileName
the name for saving pdf file (if specified)
- orderMean
specify if you want to order the rows based on row means
- speciesAnnot
a vector containing species information if you want to add top annotation on your heatmap